Getting started with QuPath v0.3.0
Learn about the new features in QuPath v0.3.0 - and the new docs
Overview
QuPath v0.3.0 isn’t quite released yet, but the first (only?) Release Candidate has been made available for this workshop.
Here, I ask you to quickly recap what you’ve (hopefully) already done with QuPath, as a prelude to exploring something new.
You can download QuPath v0.3.0-rc1 here.
The main QuPath ReadTheDocs is still for v0.2, but you can already get the docs for v0.3 at https://qupath.readthedocs.io/en/latest/.
One of the biggest changes (since yesterday) is that there are now video tutorials. Therefore if you had any trouble with the pre-workshop material, these could help:
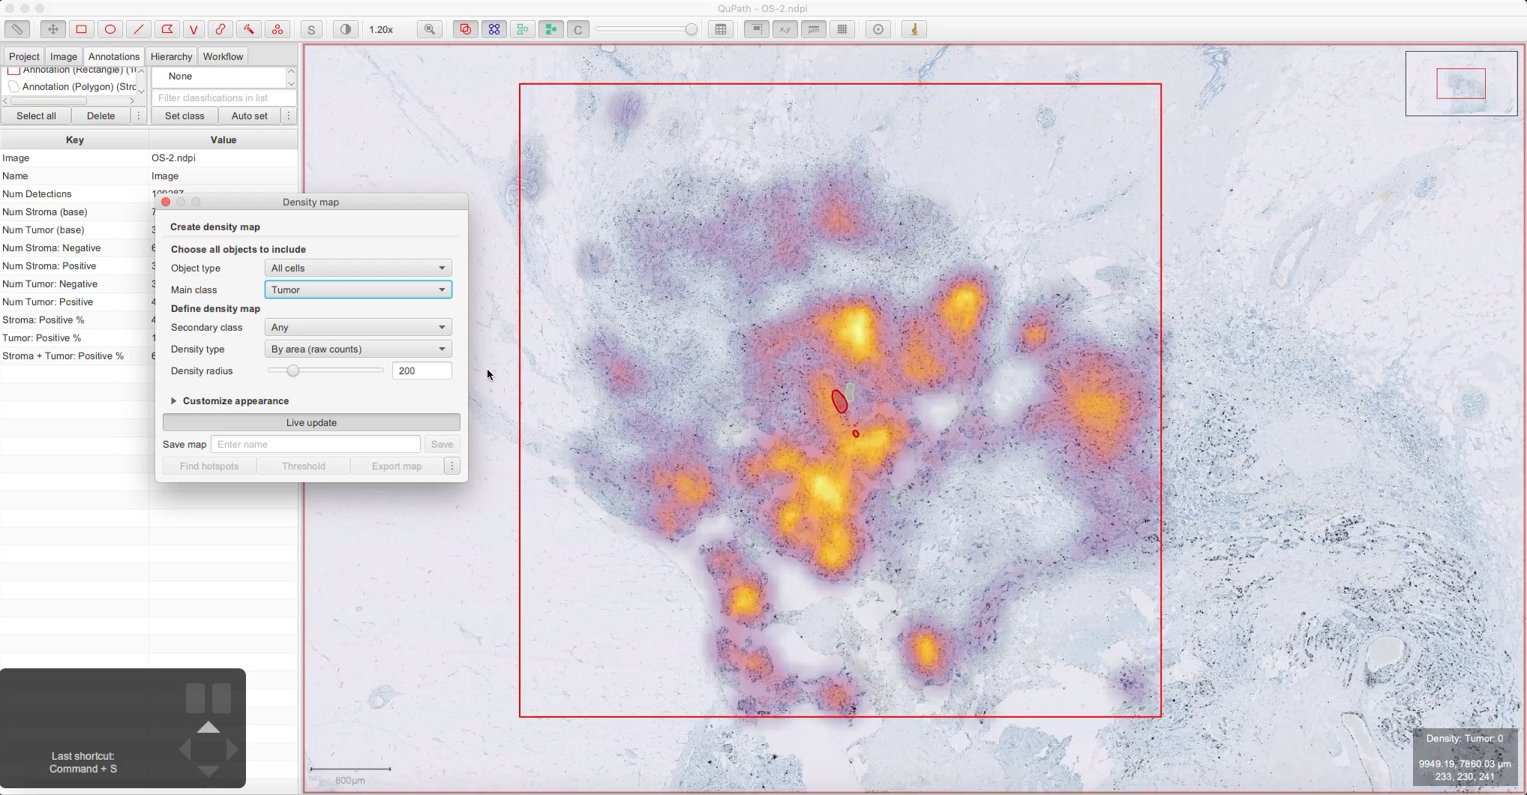
But the main purpose of this part of the workshop is to explore an entirely new feature Density maps.
Your challenge
- Create a new project and add the workshop images to it
- Open
OS-2.ndpi - Run Positive cell detection and train an object classifier to distinguish between tumor & non-tumor cells
- To speed things up, you can focus on the middle part of the image and use a Requested pixel size of 1 µm
- Find the circle with area 0.785 mm2 that contains the highest number of positive tumour cells
- Create a screenshot displaying the circle, and count how many positive tumor cells it contains
To do this, you should follow the tutorial at https://qupath.readthedocs.io/en/latest/docs/tutorials/density_maps.html and find the combination of parameters needed to get the answer.