Annotating & making measurements
Learn how to annotate images & make basic measurements in QuPath - handy for almost every use case (including ground truth data for deep learning)
Overview
QuPath is used a lot for annotating images.
And while QuPath also contains fancy image processing and machine learning methods to help automatically identify different regions, simply drawing the regions you want to assess is often quicker (and sometimes more accurate).
In this section we’ll start explore some of QuPath’s many tools & tricks to make annotating images as painless as possible.
Guided tutorial
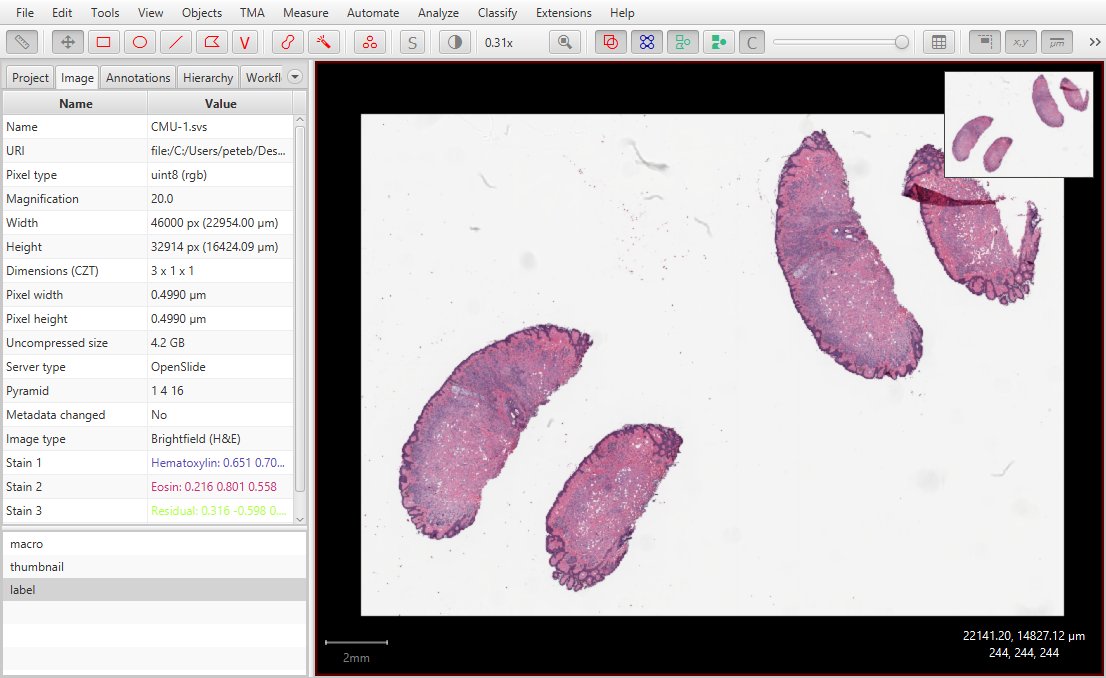
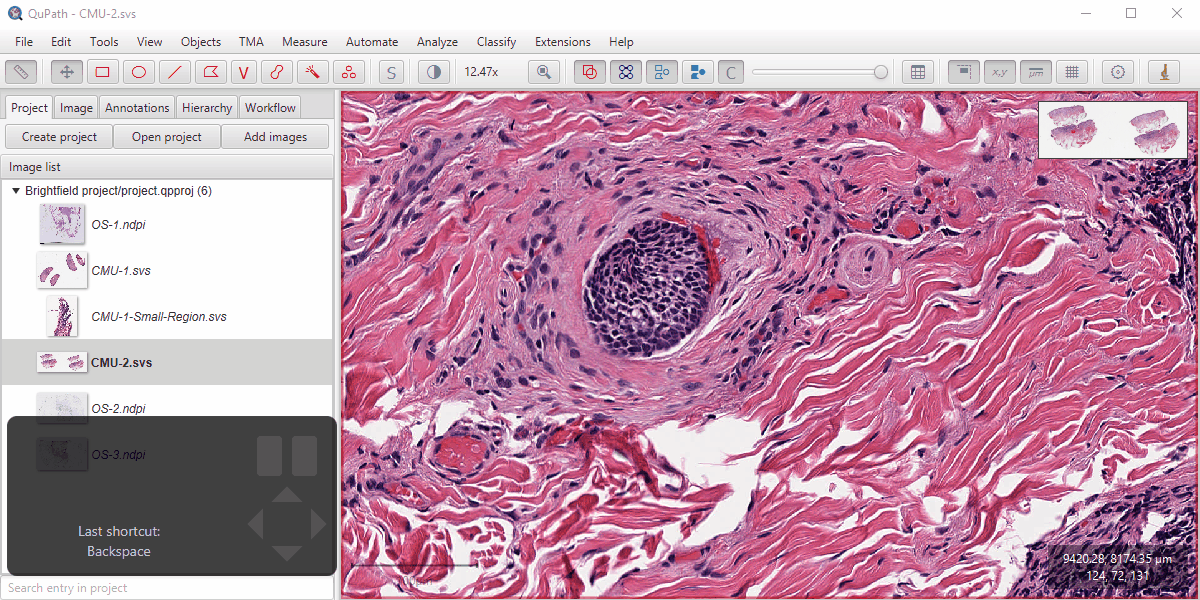
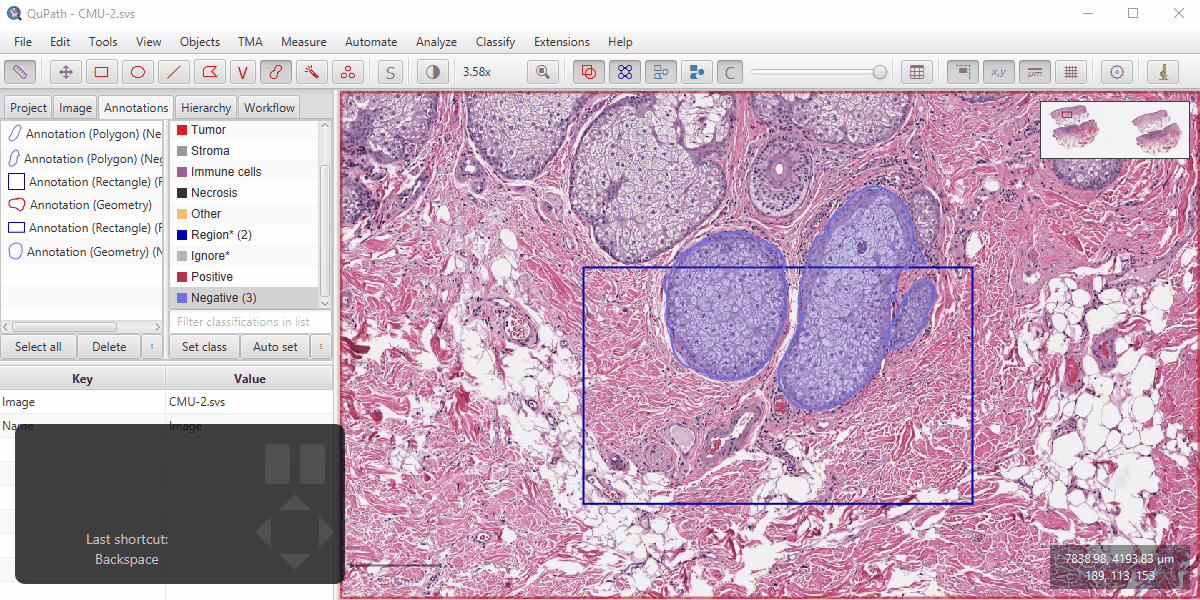
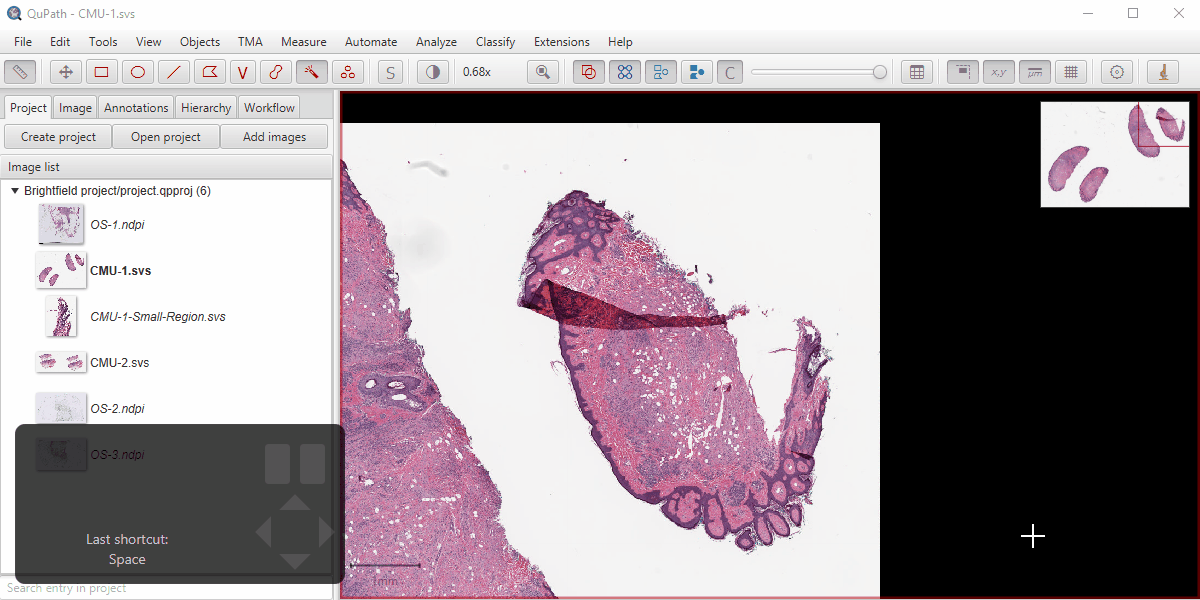
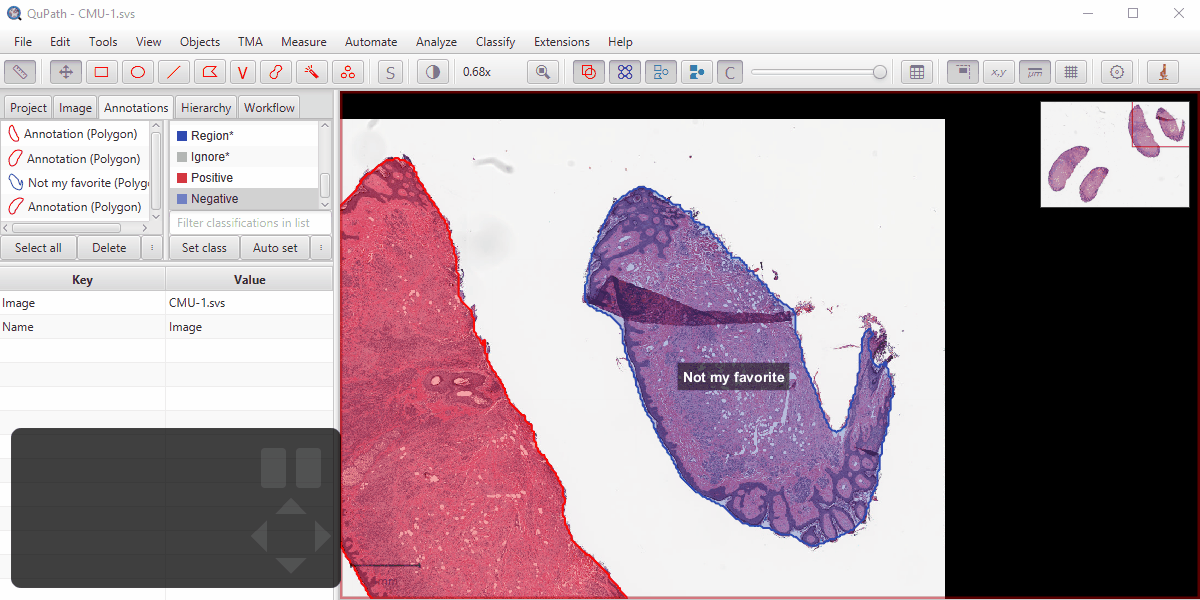
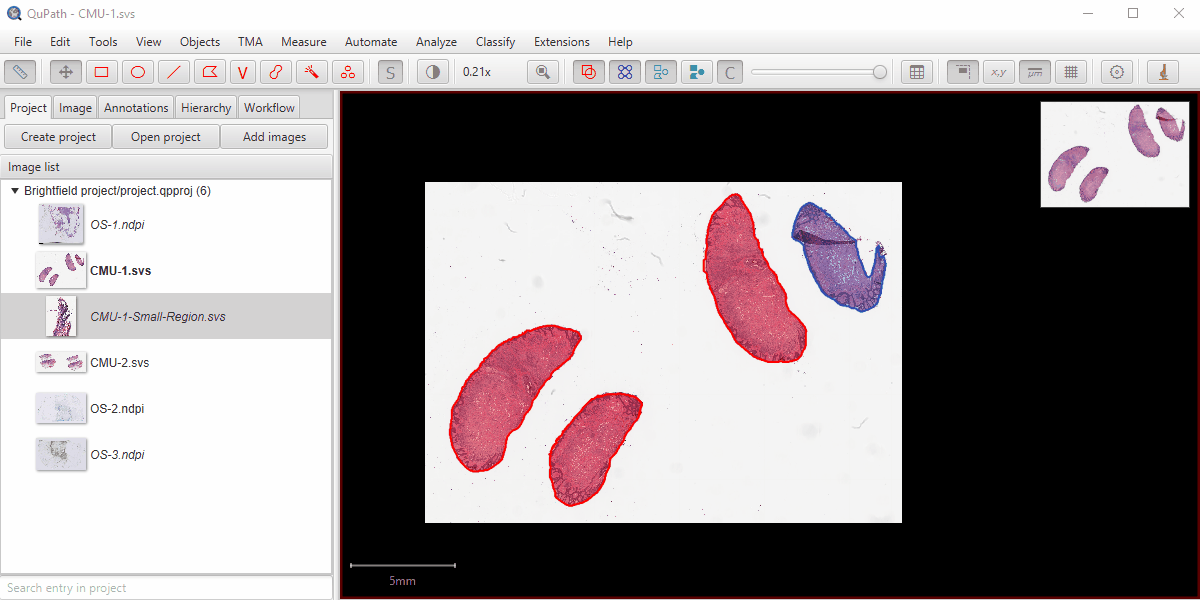
For each step below, experiment with the tools described using the image CMU-1.svs.
1. Drawing shapes
When drawing in QuPath, the main tools you’ll need are found at the left side of the toolbar:
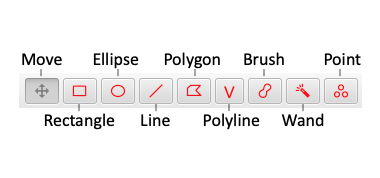
As we saw previously, Move ![]() is the tool that should be active most of the time, because it is used to navigate around the image.
is the tool that should be active most of the time, because it is used to navigate around the image.
Move will automatically be selected after using most drawing tools. However, some tools (Brush, Wand, Point) remain active. Press the
Mkey to reactivate the Move tool quickly if needed.
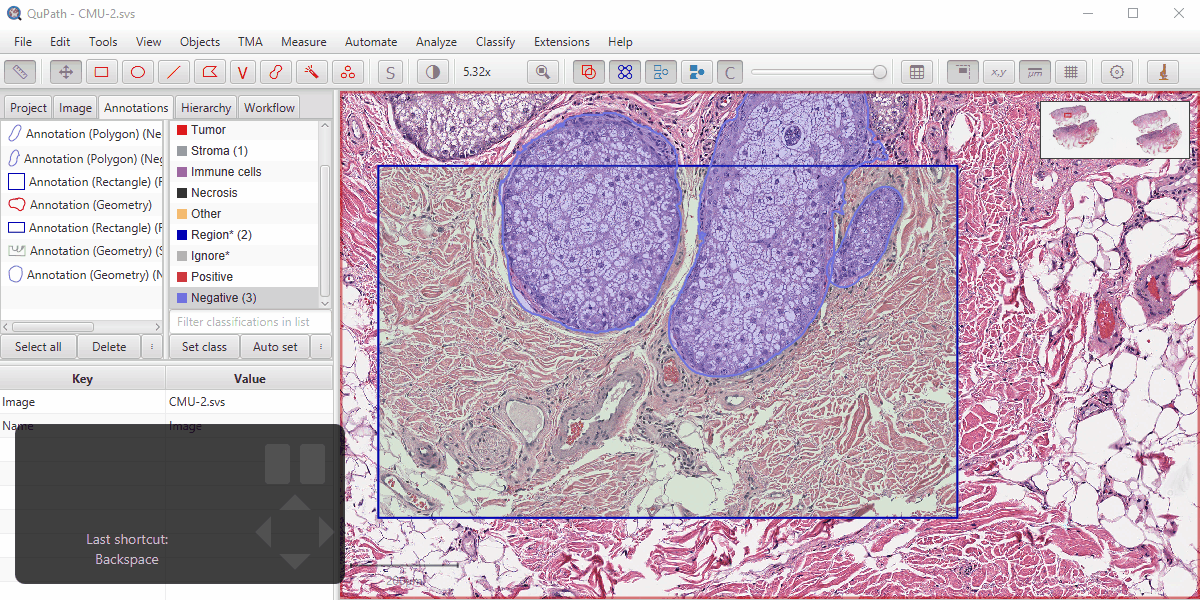
First, find some structures that look interesting in the image and then try outlining them using the Rectangle ![]() and Ellipse
and Ellipse ![]() tools.
Then use the Line
tools.
Then use the Line ![]() tool to measure the diameter a length.
tool to measure the diameter a length.
Next, try the Polygon tool ![]() .
This actually has two modes:
.
This actually has two modes:
- click points individually
- click and drag to add many points close together (freehand drawing)
If you ‘click and drag’ from the beginning when drawing a polygon, then the polygon is complete when you list the mouse button. Otherwise, double-click to add a final point and end the polygon.
The Polyline tool works in the same way – but generates a line rather than a closed shape.
Click to view: Drawing shapes
Tip: Press the Shift key while drawing rectangles, ellipses or lines to constrain the shapes.
Tip: All the drawing tools have shortcut keys – and it’s worth learning them. Find them in the Tools menu.
2. Selecting, deleting & moving
You’ll probably not want to keep every annotation you create.
By default, the selected annotation is shown in yellow. Pressing the Delete or Backspace key will remove it.
You’ll also find a list of annotations under the Annotation tab. You can use this to select and delete one or more annotations as well.
With the Move tool selected, you can double-click on an annotation in the viewer to select it. You can also click on annotations with the Alt key held down to select more than one.
Finally, with the Move tool selected if you click inside an annotation and drag the mouse then the annotation itself will move. In this way, the move tool is used not just to move around the image for viewing – but also to move annotations to different locations.
Click to view: Selecting annotations
3. Painting with the brush
The Brush tool ![]() is one of my favorites.
is one of my favorites.
This can be used to draw more complicated annotations than any of the tools we’ve previously met: for example, regions with holes inside.
There are four handy tricks to know:
- the size of the brush depends upon the magnification… so you can zoom in or zoom out to annotate larger or smaller areas
- if you press the Alt key, the brush turns into an eraser… which can be used to remove parts of annotations
- if you press the Shift key, the brush can add disconnected regions to an annotation
- if you press the Ctrl + Shift keys (or Cmd + Shift on a Mac), the brush will take into consideration other annotations… for example to avoid overlapping them, or drawing outside an existing shape
The last one is especially handy if annotating density structures – like nuclei for a custom StarDist training set.
Furthermore, you can use the brush to refine annotations created with other tools – such rectangles or polygons. Just click inside the existing annotation to select it, then modify it using the brush.
You won’t be able to draw a new annotation with a brush inside an existing annotation yet… we’ll see how to do that soon, when we look at annotation properties.
Click to view: Painting with the brush
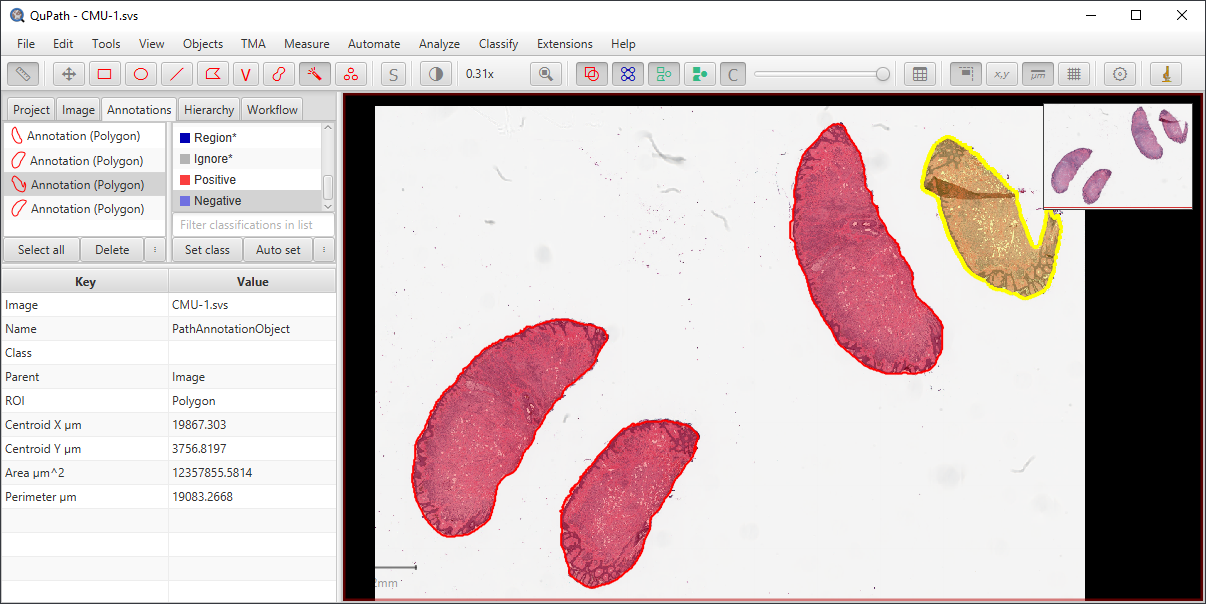
4. Mastering the wand
The Wand tool ![]() is very similar to the brush (and the same tricks apply), but with one crucial difference: it pays attention to the colors in the image.
is very similar to the brush (and the same tricks apply), but with one crucial difference: it pays attention to the colors in the image.
Therefore, with a bit of practice, it can be used to annotate regions very accurately and quickly.
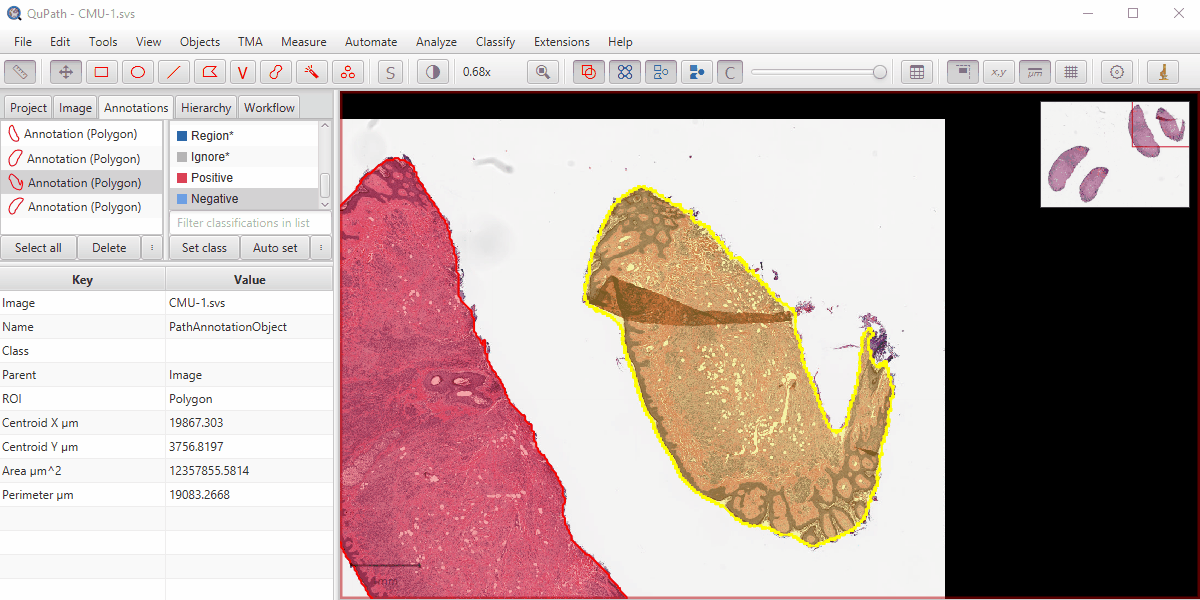
Try it out to annotate a piece of tissue, removing any whitespace or folds.
Click to view: Wand tool
Tip: Often I switch between using the wand and brush tools: using the wand as much as possible (for speed), but cleaning up the results with the brush (since its behavior is more predictable).
5. Toggling the display
Once you start drawing on an image, the underlying image itself can be obscured. Therefore you’ll need to be able to toggle annotations on and off quickly.
Do this by pressing the A key (where it is A for Annotation).
This corresponds to the ![]() button on the toolbar.
button on the toolbar.
You can also fill/unfill annotations by pressing Shift + F.
Click to view: Hiding & filling
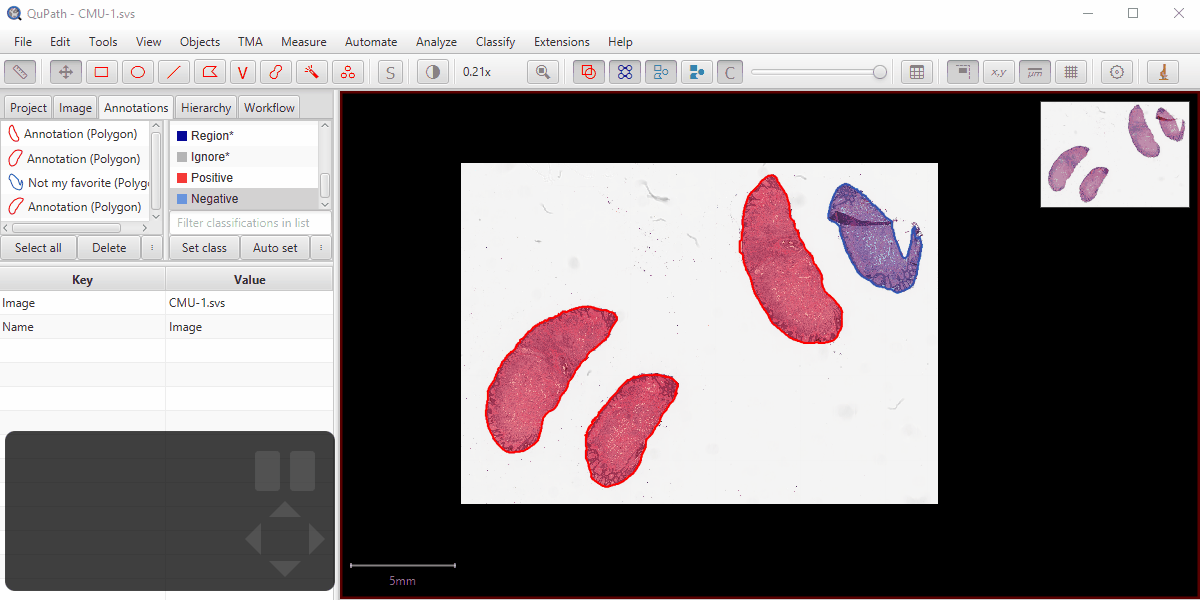
6. Colors & properties
Annotations can have extra properties, such as a name and color.
You can set these by right-clicking an annotation under the Annotations tab.
Alternatively, just select an annotation in the viewer and press Enter.
Then you can change the name and color, or even add an extra description.
But one of the most useful properties is the locked status for an annotation: this basically can be used to prevent the annotation being editable by other drawing tools (i.e. can’t be moved, or adjusted using the brush or wand).
It is helpful to set annotations to be locked if you want to make sure they aren’t changed accidentally. It is also helpful to lock annotations if you want to draw inside them using the brush or wand – since it isn’t possible to use these tools inside an unlocked annotation.
In some cases, QuPath will lock annotations automatically – for example, if they are used to define a region for cell detection.
Click to view: Setting annotation properties
Click to view: Toggling annotation names
Tip: You can change default colors and other behavior under Edit → Preferences, or via the
button.
Just start typing at the top to find the options that can be changed.
7. Viewing measurements
Measurements for the selected annotation are shown under the Annotation tab at the bottom.
The available measurements are determined automatically based upon what is available in the image. At this stage, they will include only very basic properties like area or length.
You can also generate a table of measurements for all annotations using Measure → Show annotation measurements.
8. One essential shortcut
There is one shortcut in QuPath that you really must learn: Ctrl + L (or Cmd + L on a Mac) to bring up the Command list.
The reason this is so useful is that it gives you access to everything in the menus.
You can use it to launch commands quickly (just double-click the command in the list, or select it and press Enter) – or to search for commands that contain some specific text in their name.
Tip:
Ctrl + Lis also the shortcut used to search for a command in ImageJ/Fiji… so if you are switching between software you just need to memorize it once.
Click to view: Command list
9. Other ways to edit annotations
Armed with the Command list, you can now start to type annotation and see all the relevant commands start to appear.
It is worth exploring which options are available because they can be used creatively for lots of purposes.
One particularly useful command is Objects → Annotations… → Expand annotations, which can be applied to enlarge annotations – or to shrink them, if the distance specified is negative.
Click to view: Expanding & splitting a polyline
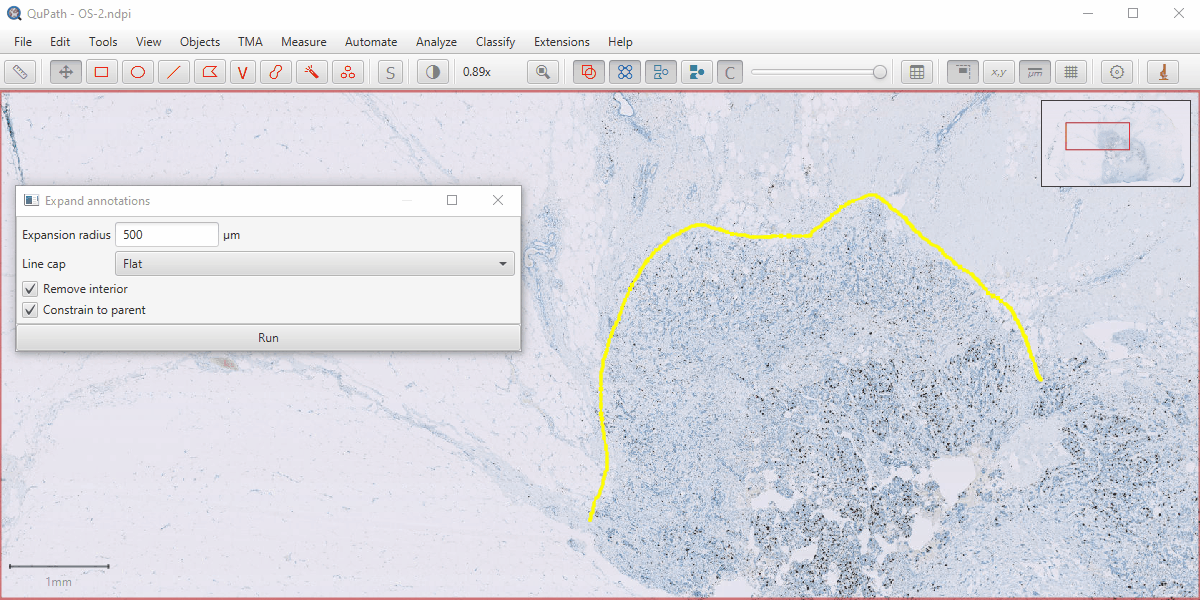
Expanding a polyline provides a good way to annotate tumor margins with a fixed line thickness (although it may well be helpful in other contexts too).
10. Saving annotations
When you’re finished creating annotations, there are three main ways to save your data:
- Choose
File -> Save - Press
Ctrl + S - Simply try to open another image and agree when QuPath asks if you want to save changes
All of these options should result in your data being saved, and available whenever you return to the image later.
Because you definitely followed the tip to create a project (right?), you won’t need to specify a location to save the data – QuPath will store it in your project.
Click to view: Saving data
11. Exporting annotations
Exporting annotations is tricky, because ‘exporting’ is is poorly defined. There are so many ways in which one might want their annotations to be export.
And, for a whole slide image, the problem is bigger because exporting at the full image resolution is rarely desirable (or possible).
QuPath’s solution to that is to provide template scripts that can be adapted to different uses.
Try this out yourself, with the goal of exporting a meaningful labelled image from your annotations.
Be careful not to try to export something impossibly large. To avoid this, either export a smaller region or use a high downsample factor to reduce the output image size.
Tip: QuPath v0.3.0 has a new File → Object data… → Export as GeoJSON option to export annotations in a non-rasterized way. GeoJSON can be understood by lots of other libraries, such as Shapely in Python.
Test yourself
Try applying what you’ve learned to answer the following questions.
If you need more information, check out the Going further section below.
Going further
See the following references for more detail:
There is also a Tweetorial about annotations here.